Transportation Sustainability Indices
Best-in-class shippers are setting the standard on transportation emissions intensity and miles driven with SmartWay carriers by industry. Powered by dynamic, shipper-transacted data, Breakthrough's sustainability indices let you measure your network’s performance—guiding smarter decisions for a sustainable future.
Sustainability indices set the benchmark for improvement
Transportation sustainability indices serve as essential tools for measuring and benchmarking environmental performance. They highlight critical data points that guide progress toward science based targets, helping companies uncover areas for improvement. These transportation indices also provide a solid framework for tracking advancements and effectively communicating results to stakeholders.
Emissions intensity by mode
Tracks sustainability progress across modes, helping identify which modes are most efficient and where improvements are needed.
Emissions intensity by industry
Highlights emissions reduction efforts across industries, offering insights into how sectors are advancing toward sustainability goals.
SmartWay Carriers by industry
Measures industry adoption of efficient carriers, showcasing progress in reducing environmental impact through smarter logistics choices.
Emissions intensity by mode
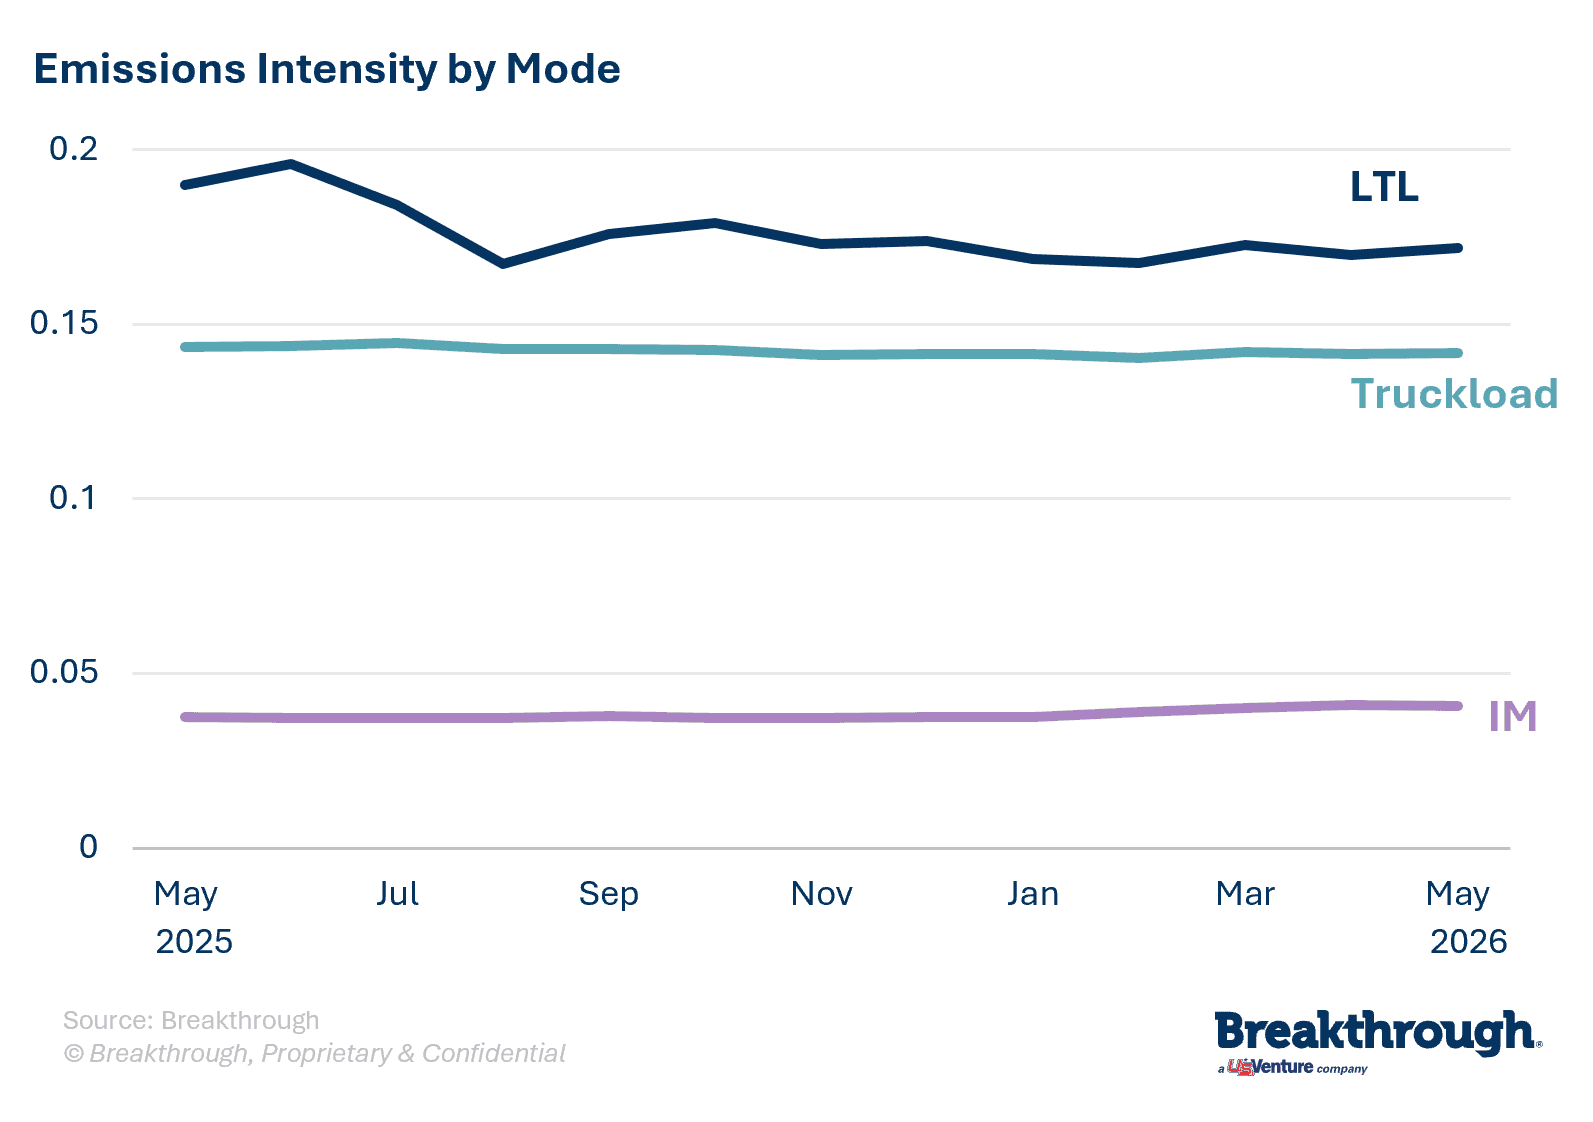
Emissions intensity measures the volume of lifecycle emissions produced against a measure of business output, in this case, measuring emissions produced by moving one ton of goods one mile. This data provides valuable insights into the progress and effectiveness of sustainability initiatives by mode.
Among the three primary freight modes analyzed, intermodal transportation delivers the lowest emissions intensity at just 0.04063 kg CO2e per ton-mile, making it the clearest choice for shippers building a lower-carbon freight strategy. Truckload (TL) comes in at 0.141683 kg CO2e per ton-mile, while less-than-truckload (LTL) carries the heaviest carbon footprint of the three at 0.171879 kg CO2e per ton-mile.
The gap is significant: TL produces approximately 3.5 times the emissions intensity of intermodal. For shippers evaluating sustainable shipping alternatives, transitioning TL volume to intermodal transportation can meaningfully reduce a network's overall transportation emissions. Additionally, consolidating fragmented LTL shipments into full truckloads — moving from 0.171879 to 0.141683 kg CO2e per ton-mile — offers a practical improvement for over-the-road transportation. Together, these two strategies give logistics and sustainability teams a data-backed framework.
Emissions intensity by industry
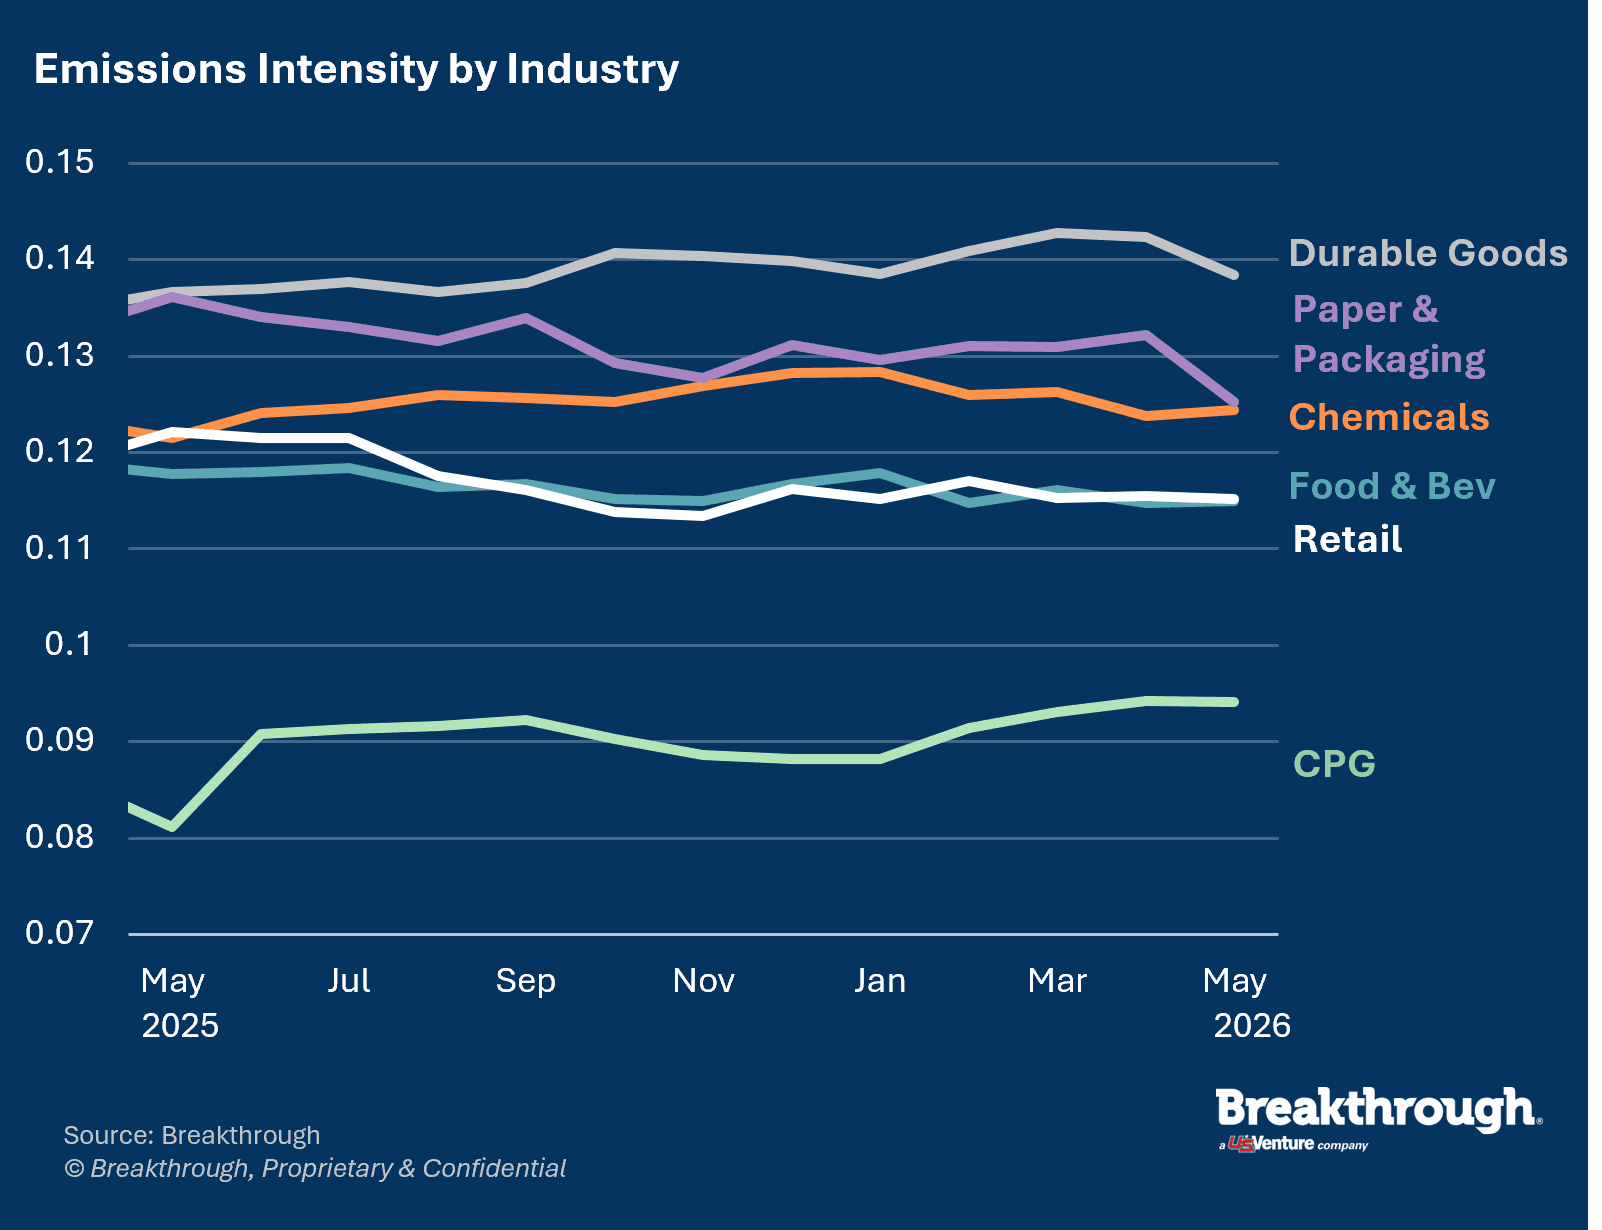
Emissions intensity measures the volume of lifecycle emissions produced against a measure of business output, in this case, measuring emissions produced by moving one ton of goods one mile. This data provides valuable insights into the progress and effectiveness of sustainability initiatives by industry.
Durable goods continues to have the highest emissions intensity, measured at 0.138467 kg of CO2e per ton-mile. However, it shows early signs of a marginal decline in emissions intensity, indicating potential progress in reducing its environmental impact. Likewise, the paper and packaging (0.125291) industry also experienced a decrease in emissions intensity. In contrast, retail (0.115167) is increasing, while food and beverage (0.115015) and chemicals (0.124461) are flat. Notably, consumer packaged goods stands out as the most environmentally efficient sector, maintaining the lowest emissions intensity at 0.094133 kg of CO2e per ton-mile. These variations are influenced by several key factors, including transportation mode choices, energy and equipment types, typical load weights, and overall carrier efficiency.
Miles driven with SmartWay Carriers by industry
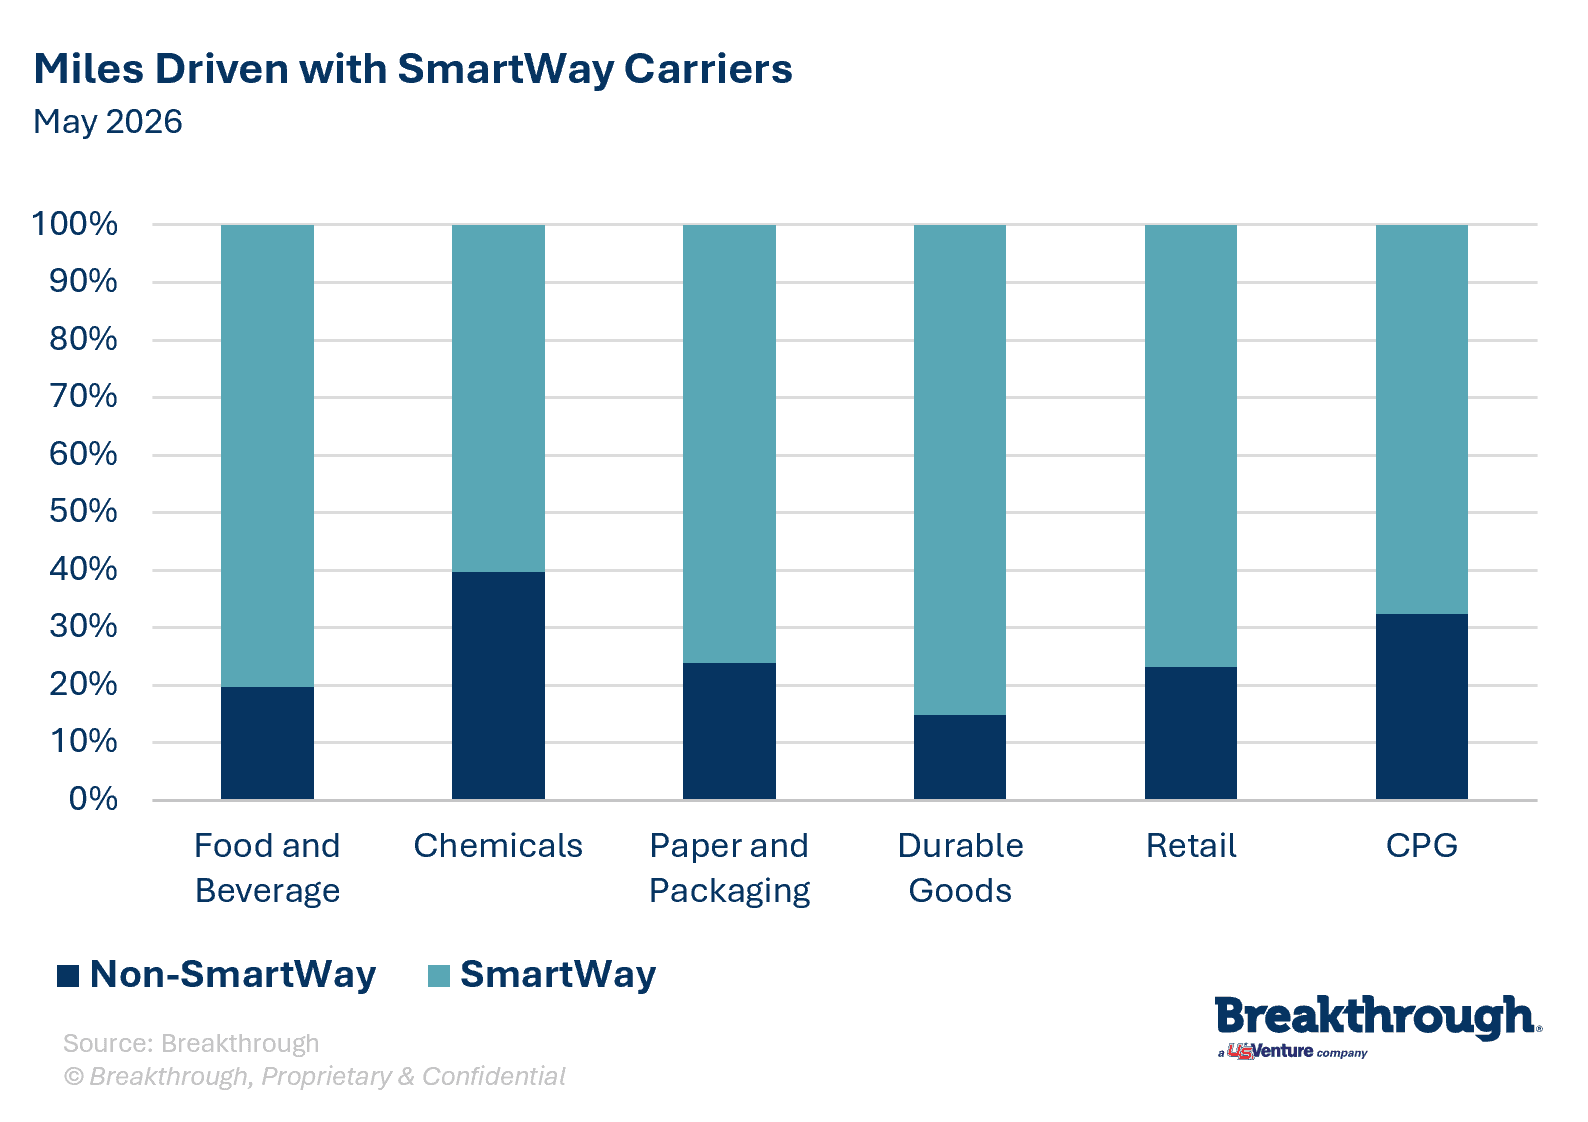
The Environmental Protection Agency’s (EPA) SmartWay program measures, benchmarks, and tracks a carrier’s efficiency and fuel economy to provide a score that reflects the carrier’s environmental impact. This data offers valuable insights into how each industry is increasing its adoption of carriers participating in the SmartWay program.
Durable goods and food and beverage shippers have embraced SmartWay carriers, with an adoption rate of 83% and 82%, respectively. In contrast, chemicals shippers show the lowest adoption rate at just 60%. Carriers are encouraged to join the SmartWay program to obtain a precise score that reflects their environmental performance, enhancing their appeal to shippers seeking efficient, sustainable transportation partners. Similarly, shippers should prioritize collaborating with SmartWay carriers to support those investing in cleaner fleets, contributing to progress toward science-based sustainability targets.

Stay informed of sustainability trends
States are the primary accelerators of emissions reduction efforts, employing grants, tax policies, and emissions regulations to improve alternative energy economics. Hawai’i has passed a clean fuel standard bill that requires a 50% fuel carbon intensity reduction by 2045. New Mexico implemented its Clean Transportation Fuel Program on April 1, 2026. Both the Hawaiian clean fuel standard and New Mexico CTFP will create new market opportunities for alternative energies, complementing similar programs in Washington, Oregon, and California, and may also lead to spillover benefits for neighboring states. Alongside state policies, the 45Z Clean Fuel Production Tax Credit will support alternative energy production, once final IRS guidance is available, a development that may come soon.
Aside from policy, geopolitical, economic, geographic, and infrastructure factors influence alternative energy adoption. Notably, natural gas, especially renewable natural gas (RNG), is receiving greater attention because it is not as geographically constrained or limited by infrastructure development relative to other alternative energies. Renewable diesel and heavy-duty electric vehicles are gaining traction as well. The momentum behind alternative energies continues to gain ground as businesses realize the benefits of fuel diversification, cost stability, and emissions reduction.
About the Breakthrough Dataset
The Breakthrough ecosystem is one of the cleanest and most robust sets of transportation data in the U.S.
46.5 million shipments
$35 billion in transportation spend
16.5+ billion commercial miles
2.5 billion gallons of diesel fuel
Meet shippers reducing their carbon footprint
Our insights have empowered shippers to streamline operations, lower costs, and work toward achieving ambitious science-based targets. Shippers using CleanMile achieve an average 6% reduction in emissions intensity (kgCO2E/ton-mile) during their first year.
Compare your network to the industry
Take the next step in your sustainability journey. Assess your network data in relation to industry benchmarks.